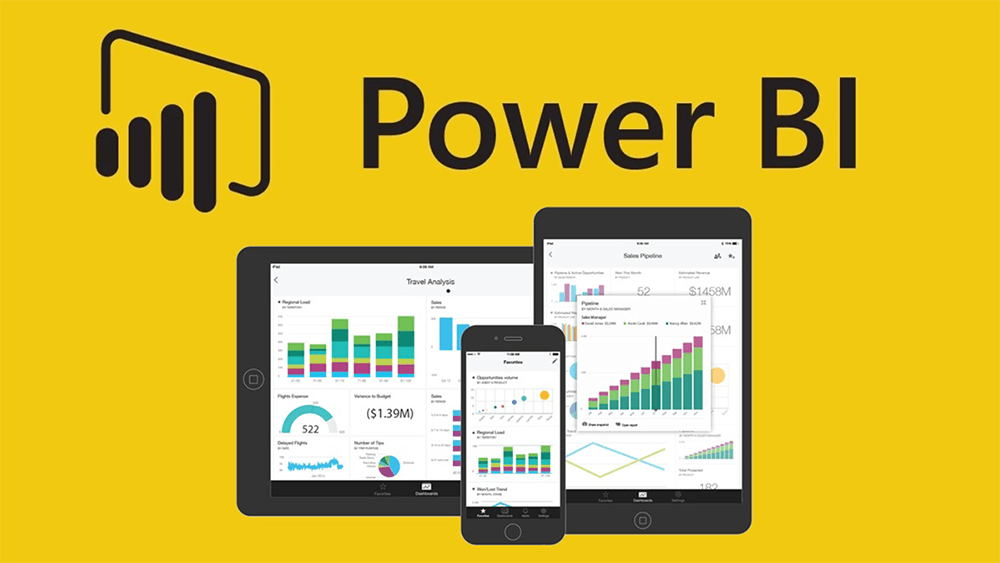
Currently, the market for systems that optimize the decision-making process has increased. In this article we will meet a powerful versatile tool that will allow us to process and transform information from Microsoft Excel, Access, .TXT, SQL, Oracle, Facebook and Google Analytics.
Power BI is a software classified as a Business Intelligence tool, which allows you to organize and convert data into very attractive visual reports, for business analysis and as support for decision-making. This tool allows you to work with data from very complex sources, as well as a programming language.
In addition, Power BI allows you to convert information into coherent and interactive reports, generally through data originated under the Microsoft Excel tool, although it also allows you to work with local or cloud-based hybrid data warehouses.
These reports generated by the tool can be shared with anyone, and although this tool is aimed at a more corporate audience, students can make use of it and find multiple uses for it.
The full suite of Power BI has 4 applications:
- Power BI Desktop
- Power BI Mobile (Android & IOS)
- Power BI Pro
- Power BI Professional
Tabla de contenido
ToggleWorkflow

The Power BI workflow begins with Power BI Desktop, where we can import the data from Microsoft Excel, later, these reports will be published in the Power BI virtual service, where we can view the reports and share them for mobile phones, tablets or computers. desktop.
How much does POWER BI cost?
In its basic version, Power BI is free, and you can download it completely free. However, this tool also has paid versions, with some additional options.

The payment for the professional service is currently $9.99 and has self-service options in the cloud.
How to download POWER BI?
To download this tool for free, you must go to the official Microsoft Power BI download page and choose the tool you need, either the desktop version or the mobile version.
Basic Power BI interface

In the home environment, you will find the HOME tab, where we will find very essential tools to import data, insert a graphic, etc.
In the VIEW tab, you will find options to determine how we want to view the reports we have created, as well as the organization of the reports for the mobile version.
In the MODELING tab, we will find tools to manage and format data sources.
Finally, in the HELP tab we will find all the help material to work with Power BI, as well as links to enter the community.


